FSConsultory

BUSINESS INTELLIGENCE CONSULTANT

Turning data
into executive decisions.

Independent consultant in Business Intelligence and applied AI · Santiago, Chile.

// fsconsultory.py
class FSConsultory:
nombre = "Francisco Santelices"
rol = "Business Intelligence Consultant"
stack = ["Power BI", "SQL", "Python", "IA"]
años_exp = 7
disponible = True

// 01 — About

About me.

Francisco Santelices
ICI · UDP · Santiago

I'm Francisco Santelices, an Industrial Civil Engineer from Universidad Diego Portales, with over 7 years building Business Intelligence solutions in retail and commercial environments.

My work goes beyond dashboards. What drives me is building tools people actually use — reports that sit on a manager's screen every morning, models that surface fraud before it costs money, and systems that make data feel less like a spreadsheet and more like a decision.

I've worked across retail chains with 600+ locations, financial regulatory environments, and multinational operations — always focused on turning complexity into clarity. Today I integrate AI agents into analytical workflows to push that clarity even further.

7+
Years of experience
600+
Operational locations
50%
Faster reporting
9
Expert & advanced tools
3
Masters · Power BI · Python · AI
4
Countries · Multinational projects
// 02 — Experience

Professional Journey.

08/2019 — Present
Senior BI & Loss Prevention AnalystCURRENT
Empresas SB
  • Architected end-to-end BI solutions in Power BI (star schema, DAX, RLS) consumed daily by C-level and operational teams — cutting reporting cycles from days to hours.
  • Built anomaly detection models in Python + SQL monitoring loss and fraud signals across 600+ nationwide retail locations, strengthening internal control significantly.
  • Designed the national commercial KPI model (RANKX, TOPN, CALCULATE) aligning salesperson incentives with real business outcomes — deployed across all branches.
  • Optimized inventory management through stockout and overstock analytics, reducing dead stock and improving category replenishment cycles.
  • Led the national bonus calculation process, ensuring full traceability and precision across all commercial areas.
  • Monitor retail-supplier commercial agreement performance through KPI analysis (Loss/Purchase ratio), identifying deviations and providing data-driven evidence to support contract renegotiations.
Power BISQLPythonExcel
2018
2 months
Professional Internship
SBIF — Modeling Dept.
  • Work carried out in the Modeling and Methodology Department. Research, creation and study of probabilistic models to understand phenomena in the Chilean banking sector, laying the foundations of Basel II (the fundamental banking regulatory framework of the Basel Committee on Banking Supervision).
Probabilistic ModelsBanking
2017
2 months
Operations Internship
ICIL-ICAFAL Maquinaria S.p.A
  • Supported machinery rental, maintenance and fleet management processes.
Operations
// 03 — Services

How can I help you?

01 / 📊

Executive Dashboards

Power BI reports connected to real data. Leadership sees the business in real time, no spreadsheets.

02 / 🔍

Operational Control & Loss Prevention

Identify deviation, fraud and inefficiency patterns. Proven across 600+ locations.

03 / ⚙️

Custom Data Models

SQL, Python and Excel models automating repetitive analysis and generating actionable indicators.

04 / 🤖

AI Agents

Develop and integrate AI agents into analytical and operational processes, boosting decision quality.

05 / 💬

Data Communication

Translate complex analysis into clear language for executive, commercial and operational teams.

06 / 🎯

Commercial Optimization

Incentive models and KPIs aligned with real business outcomes through data and AI.

// 04 — Process

From data to results.

🔎
Diagnosis
Understand your business, data and the real problem.
✏️
Design
Define architecture, key metrics and deliverables.
⚙️
Development
Build models, dashboards or agents.
🚀
Implementation
Deploy in your real environment.
🎓
Training
Transfer knowledge for team autonomy.
// 05 — Tech Stack

Tools I work with.

UTN ★
Power
BI
EXPERT
UTN ★
Python ADVANCED
UTN ★
Artificial
Intelligence
ADVANCED
SQL EXPERT
Excel EXPERT
STATA ADVANCED
SPSS ADVANCED
Claude ADVANCED
AI Agents ADVANCED
★ Certificado UTN Curitiba, Brasil Expert Advanced
// 06 — Results

Measurable impact.

Reporting Time Reduced by 50%
Executive Power BI dashboards with DAX time intelligence (YTD, MTD, YoY) and star schema modeling deployed in Power BI Service with row-level security. Used daily by leadership and strategic areas across a 4-branch retail chain.
↓ 50% · Power BI · DAX · Star Schema · RLS
🔍
Fraud Detection Across 600+ Locations
Python + SQL anomaly detection models monitoring deviation patterns and fraud signals across a nationwide operational network of 600+ retail points. Strengthened internal control and reduced operational losses significantly.
600+ pts · Python · SQL · Anomaly Detection · Power BI
🎯
National Bonus & KPI Incentive Model
RANKX + TOPN + CALCULATE DAX model redesigning the national commercial incentive scheme. Aligned salesperson performance metrics with real business outcomes across all branches, increasing commercial team effectiveness.
↑ Commercial ROI · DAX · RANKX · TOPN · CALCULATE
// 07 — Portfolio

Power BI Work.

Real projects developed for companies across different industries and countries.

01 / RETAIL
01 / RETAIL BI

Multi-Branch Retail Dashboard

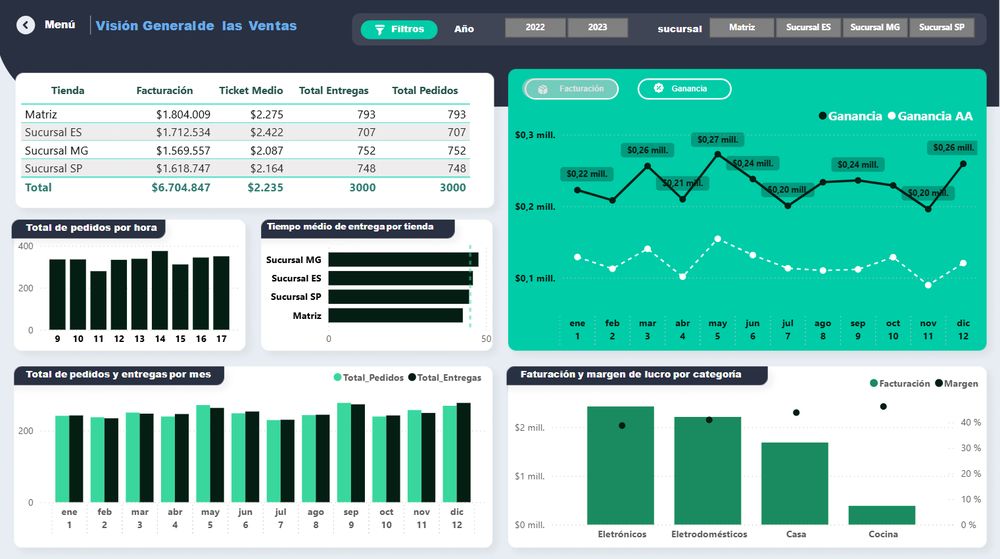
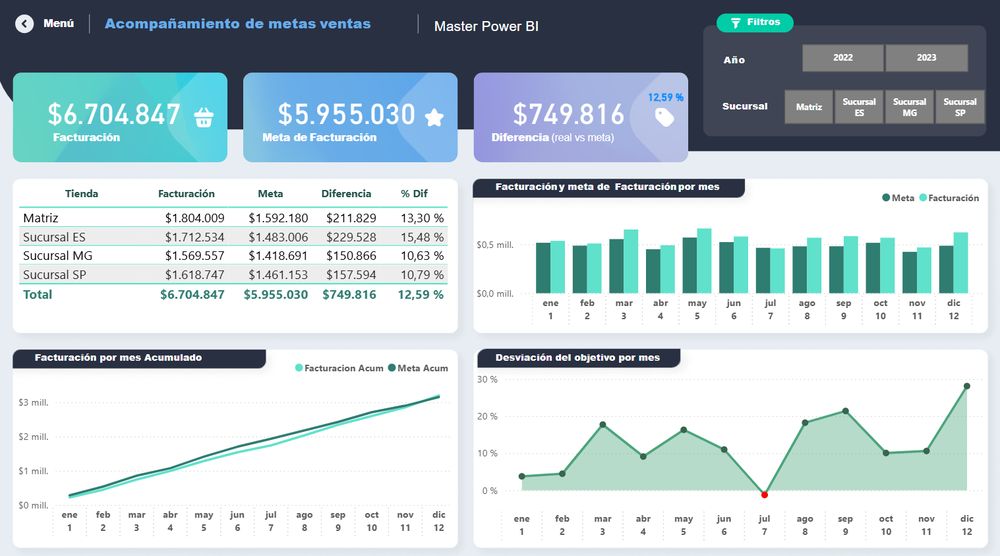
Solución Power BI end-to-end con ETL en Power Query, modelamiento en estrella y capa semántica DAX. Mide throughput operacional (pedidos/hora), tasa de cumplimiento de entregas, evolución de ganancia vs período anterior (AA) y rentabilidad por SKU de categoría. Publicado en Power BI Service con RLS por sucursal.

Power BI DAX Power Query ETL RLS Star Schema YTD / MTD
$6.7M
BILLING
4
BRANCHES
3.000
ORDERS/YEAR
02 / COMMERCIAL BI

Commercial Analytics Platform

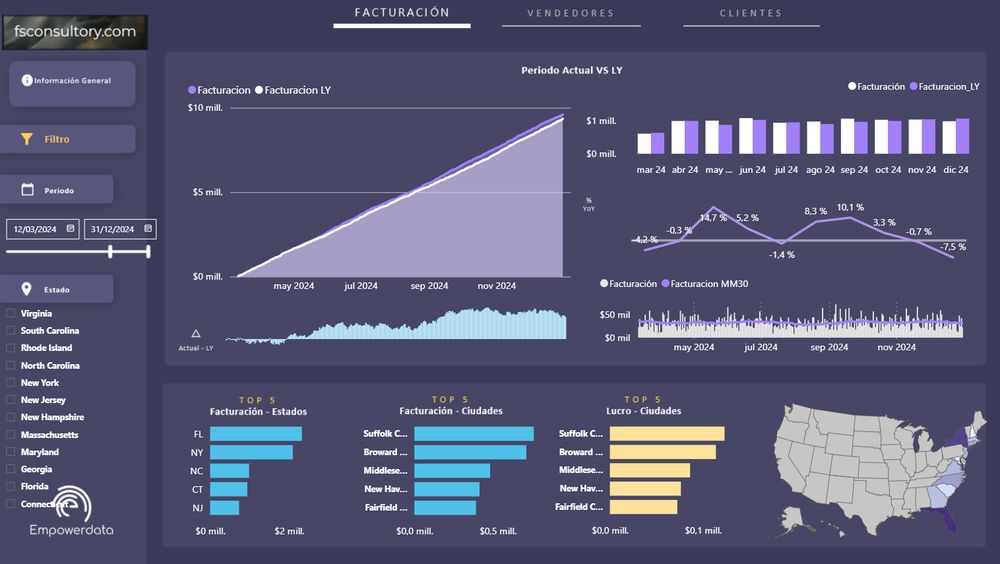
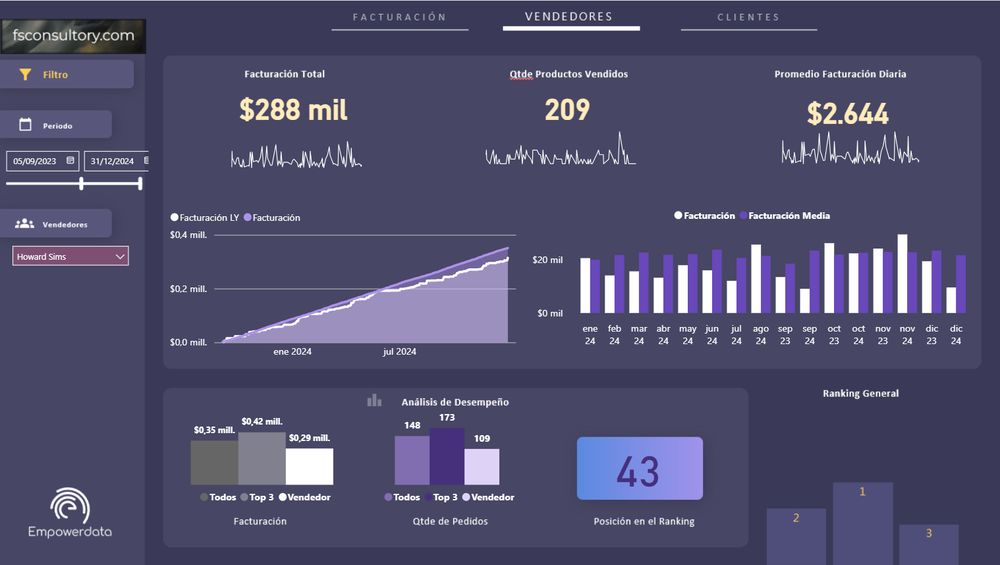
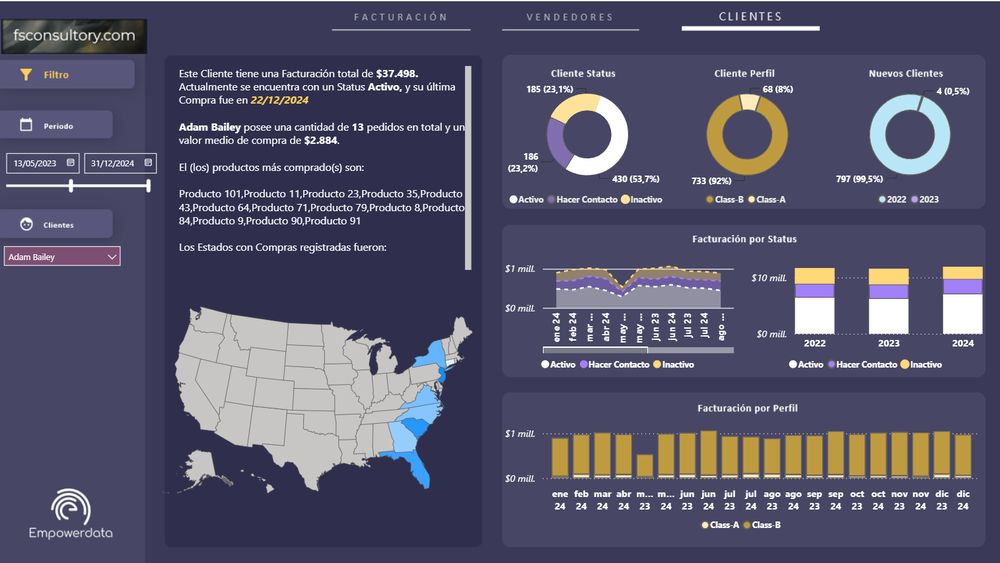
Sistema de BI con modelo relacional de alta cardinalidad (800+ clientes, 12+ estados). Implementa medidas de inteligencia de tiempo con DATEADD y CALCULATE para comparativos período actual vs LY. Incluye visualizaciones geoespaciales con Bing Maps, tooltips enriquecidos y drill-through entre módulos. Segmentación de clientes por status y clasificación Class-A/Class-B con lógica DAX condicional.

Power BI DATEADD CALCULATE Drill-through Bing Maps RFM High Cardinality
3
MODULES
800+
CLIENTES
12+
ESTADOS
02 / COMMERCIAL BI
03 / MULTINATIONAL XSales Dashboard
03 / MULTINATIONAL BI

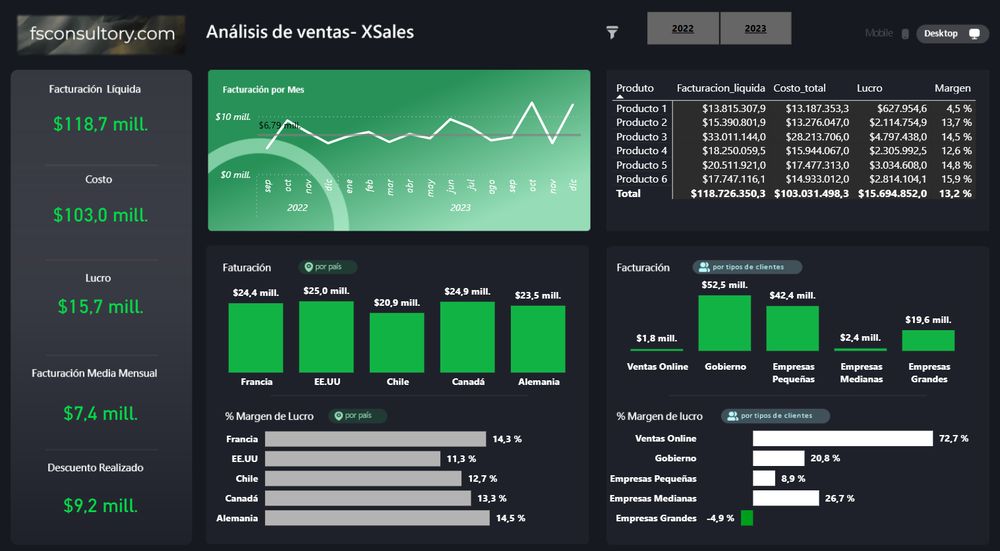
Multinational Sales Analysis — XSales

Snowflake schema adapted for 5-country operations. Country → Customer Type → Product drill-down hierarchy. Calculated measures for marginal contribution per SKU, ROI by market and discount elasticity. Responsive Mobile/Desktop layouts via bookmarks.

Power BI Snowflake Schema Drill-down P&L Analysis Bookmarks Margin Analysis Responsive
$118.7M
BILLING
5
COUNTRIES
13.2%
MARGEN
04 / SALES TRACKING

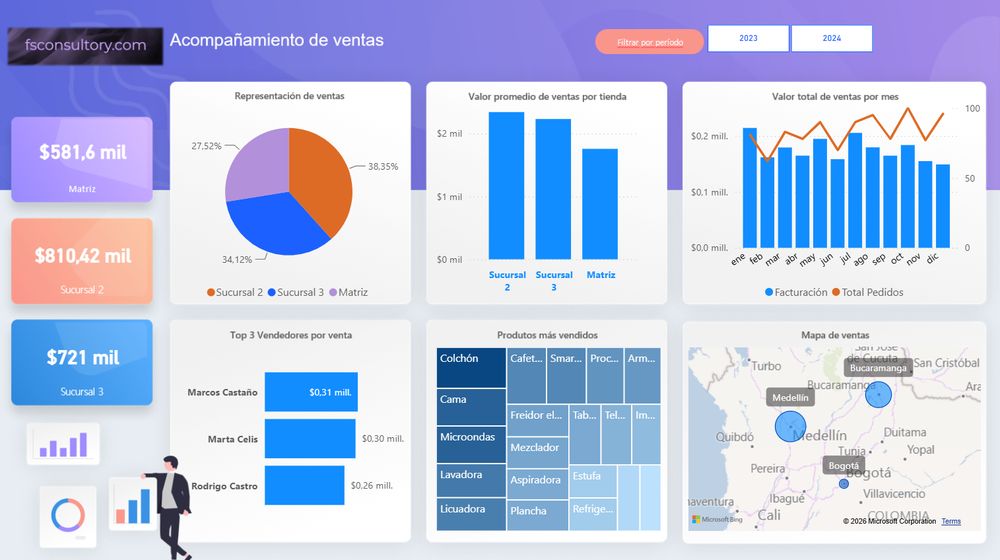
Sales Tracking Dashboard — Colombia

Star schema operational dashboard (sales facts + store, salesperson, product, date dimensions). DAX measures for market share by branch, category rotation speed and salesperson benchmark vs team average. Conditional treemap and geographic map of Colombia.

Power BI RANKX TOPN Star Schema Bing Maps Treemap Benchmark DAX
3
BRANCHES
MED·BOG·BUC
CITIES
04 / SALES TRACKING Colombia Sales Dashboard
View Full Portfolio →
// 08 — Get in Touch

Tell me your challenge.

Please enter your name
Please enter a valid email
Please write your message
// 09 — Contact

Let's Talk.

About Experience Services Stack Portfolio Contact
EN
ES
inLinkedIn
🇺🇸 CV EN 🇨🇱 CV ES